
SMART monitoring with nux
By Thomas Sileo • • 11 min read
I’ve been worrying about my NAS drives lately and wanted to start monitoring disks health using SMART (Self-Monitoring, Analysis and Reporting Technology).
nux is a new part of my self-hosted infrastructure that ingests events (and provides notifications). It’s a perfect fit to track disks health.
nux comes with a suite of tools from a basic CLI (nux-notify) to tools for monitoring cron jobs (nux-wrap), but for monitoring disks, I’m going to demo nux-analyze.
nux-analyze is a tool that uses Lua scripts to extract events from log files and any structured data.
Step 1: Getting the SMART Data
smartctl (from smartmontools) is a CLI tool that can read SMART data from the drive.
-H outputs the “health status”, the passed boolean flag:
sudo smartctl --json -H /dev/sda1
{
  "json_format_version": [
    1,
    0
  ],
  "smartctl": {
    "version": [
      7,
      4
    ],
    "pre_release": false,
    "svn_revision": "5530",
    "platform_info": "x86_64-linux-6.14.0-37-generic",
    "build_info": "(local build)",
    "argv": [
      "smartctl",
      "--json",
      "-H",
      "/dev/sda1"
    ],
    "drive_database_version": {
      "string": "7.3/5528"
    },
    "exit_status": 0
  },
  "local_time": {
    "time_t": 1771961410,
    "asctime": "Tue Feb 24 20:30:10 2026 CET"
  },
  "device": {
    "name": "/dev/sda1",
    "info_name": "/dev/sda1 [SAT]",
    "type": "sat",
    "protocol": "ATA"
  },
  "smart_status": {
    "passed": true
  }
}
-A outputs vendor-specific attributes and values, i.e. metrics
sudo smartctl --json -A /dev/sda1
{
  "json_format_version": [
    1,
    0
  ],
  "smartctl": {
    "version": [
      7,
      4
    ],
    "pre_release": false,
    "svn_revision": "5530",
    "platform_info": "x86_64-linux-6.14.0-37-generic",
    "build_info": "(local build)",
    "argv": [
      "smartctl",
      "--json",
      "-A",
      "/dev/sda1"
    ],
    "drive_database_version": {
      "string": "7.3/5528"
    },
    "exit_status": 0
  },
  "local_time": {
    "time_t": 1771961544,
    "asctime": "Tue Feb 24 20:32:24 2026 CET"
  },
  "device": {
    "name": "/dev/sda1",
    "info_name": "/dev/sda1 [SAT]",
    "type": "sat",
    "protocol": "ATA"
  },
  "ata_smart_attributes": {
    "revision": 10,
    "table": [
      {
        "id": 1,
        "name": "Raw_Read_Error_Rate",
        "value": 80,
        "worst": 64,
        "thresh": 44,
        "when_failed": "",
        "flags": {
          "value": 15,
          "string": "POSR-- ",
          "prefailure": true,
          "updated_online": true,
          "performance": true,
          "error_rate": true,
          "event_count": false,
          "auto_keep": false
        },
        "raw": {
          "value": 102659272,
          "string": "102659272"
        }
      },
      [...]
    ]
  },
  "power_on_time": {
    "hours": 5425
  },
  "power_cycle_count": 7,
  "temperature": {
    "current": 37
  }
}
Reading SMART data requires root, so I chose to run a script as root that dumps the output to a log file (JSONL is the format for new-line-delimited JSON objects):
#!/bin/bash
for disk in /dev/sd? /dev/nvme?n?; do
    [ -e "$disk" ] || continue
    sudo smartctl -A -H --json "$disk" 2>/dev/null | \
        jq -c --arg disk "$disk" '{disk: $disk} + .'
done > /var/log/smart.jsonl
Now that the data is in a JSONL log file, we can write a nux-analyze script to process it.
Step 2: Generating Events for nux
Lua scripts for nux have a send helper to send events to nux. It also expects 3 functions:
initto setup variables/shared stateon_linetriggered for each input line, in our case, a JSON object per line with the SMART data for each drive- this function can aggregate data
finishused to compute the summary
You can see the full documentation for nux-analyze in the repo.
One thing to know before diving into the script is that ATA (traditional HDD/SSD) and NVMe drives expose different health data. The script handles both.
For NVMe, the important bit is percentage_used, a field that represents the estimated consumed lifespan of the drive.
For ATA attributes, I relied on Backblaze’s analysis and picked the ones they found most predictive of failures: reallocated sectors, uncorrectable errors, pending sectors, and a few others.
Also, one gotcha worth knowing: the raw value for attribute 194 (temperature) on some drives packs historical min/max into the high bytes, so you need to mask it (raw % 256) (extracting the last byte) to get the actual current temperature. In my initial testing I got crazy-high values before figuring this out.
Here is an excerpt of the script (full version):
-- analyzers/smart.lua
-- Analyzes smartctl --json output, tracks attribute changes, alerts on degradation.

local CRITICAL_ATTRS = {
    [5]   = "Reallocated_Sector_Ct",
    [10]  = "Spin_Retry_Count",
    [187] = "Reported_Uncorrect",
    [188] = "Command_Timeout",
    [194] = "Temperature_Celsius",
    [197] = "Current_Pending_Sector",
    [198] = "Offline_Uncorrectable",
    [199] = "UDMA_CRC_Error_Count",
}

function init(ctx)
    ctx.disks = {}
    ctx.lines_seen = 0
end

function on_line(ctx, line, n)
    if type(line) ~= "table" then return end
    ctx.lines_seen = ctx.lines_seen + 1

    local disk = line.disk or "unknown"
    local short = disk:gsub("/dev/", "")
    local info = { disk = disk, warnings = {}, fields = {} }

    -- Overall health
    local passed = true
    if line.smart_status and line.smart_status.passed == false then
        passed = false
        send({
            event_type = "disk.smart_failed",
            level = "error",
            title = string.format("SMART health FAILED: %s", disk),
            message = string.format("SMART overall health test failed for %s", disk),
            source = ctx.source,
            priority = 5,
            fields = { disk = disk },
        })
    end

    -- Check critical ATA attributes
    [...]

    -- NVMe health
    if line.nvme_smart_health_information_log then
        local nvme = line.nvme_smart_health_information_log
        local pct = nvme.percentage_used or 0
        local spare = nvme.available_spare or 100
        local temp = nvme.temperature or 0
        local media_errors = nvme.media_errors or 0
        info.fields.percentage_used = pct
        info.fields.available_spare = spare
        info.fields.temperature = temp
        info.fields.media_errors = media_errors

        local prev_media_key = short .. "_nvme_media_errors"
        local prev_media = ctx.state[prev_media_key] or 0
        if media_errors > 0 then
            table.insert(info.warnings, string.format("NVMe media_errors = %d", media_errors))
        end
        if media_errors > prev_media and prev_media > 0 then
            send({
                event_type = "disk.smart_nvme_errors",
                level = "error",
                title = string.format("NVMe %s media errors increasing: %d -> %d", disk, prev_media, media_errors),
                message = string.format("NVMe %s media_errors went from %d to %d", disk, prev_media, media_errors),
                source = ctx.source,
                priority = 5,
                fields = { disk = disk, previous = prev_media, current = media_errors },
            })
        end
        ctx.state[prev_media_key] = media_errors

        if pct > 90 then
            table.insert(info.warnings, string.format("NVMe %d%% used", pct))
            send({
                event_type = "disk.smart_nvme_wear",
                level = "warn",
                title = string.format("NVMe %s at %d%% used", disk, pct),
                message = string.format("NVMe %s percentage_used = %d%%, available_spare = %d%%", disk, pct, spare),
                source = ctx.source,
                priority = 4,
                fields = { disk = disk, percentage_used = pct, available_spare = spare },
            })
        end
        if spare < 20 then
            table.insert(info.warnings, string.format("NVMe spare at %d%%", spare))
            send({
                event_type = "disk.smart_nvme_spare",
                level = "error",
                title = string.format("NVMe %s spare low: %d%%", disk, spare),
                message = string.format("NVMe %s available_spare = %d%%", disk, spare),
                source = ctx.source,
                priority = 5,
                fields = { disk = disk, percentage_used = pct, available_spare = spare },
            })
        end
        if temp > 70 then
            table.insert(info.warnings, string.format("NVMe temp %d C", temp))
            send({
                event_type = "disk.smart_nvme_temp",
                level = "warn",
                title = string.format("NVMe %s temperature high: %d C", disk, temp),
                message = string.format("NVMe %s temperature = %d C (threshold: 70 C)", disk, temp),
                source = ctx.source,
                priority = 4,
                fields = { disk = disk, temperature = temp },
            })
        end
    end

    info.passed = passed
    ctx.disks[disk] = info
end

function finish(ctx)
    if ctx.lines_seen == 0 then
        return
    end

    local all_ok = true
    local lines = {}
    local disk_count = 0
    local summary_fields = {}

    for disk, info in pairs(ctx.disks) do
        disk_count = disk_count + 1
        local short = disk:gsub("/dev/", "")

        if #info.warnings > 0 then
            all_ok = false
            table.insert(lines, string.format("%s: %s", disk, table.concat(info.warnings, ", ")))
        else
            table.insert(lines, string.format("%s: OK", disk))
        end

        summary_fields[short] = info.fields
    end

    if disk_count == 0 then
        return
    end

    summary_fields.disk_count = disk_count
    local message = table.concat(lines, "\n")

    if not all_ok then
        send({
            event_type = "disk.smart_summary",
            level = "warn",
            title = string.format("SMART: warnings detected across %d disks", disk_count),
            message = message,
            source = ctx.source,
            priority = 3,
            fields = summary_fields,
        })
    else
        send({
            event_type = "disk.smart_summary",
            level = "info",
            title = string.format("SMART: %d disks OK", disk_count),
            message = message,
            source = ctx.source,
            priority = 1,
            fields = summary_fields,
        })
    end
end
Now we just need to run it through nux-analyze:
nux-analyze --reset --script smart.lua /var/log/smart.jsonl
By default, nux-analyze processes log files incrementally, saving its cursor position between runs.
--reset reprocesses the whole file (the script is overriding the log file each time, and contains one line per drive).
And here is the result in the UI:
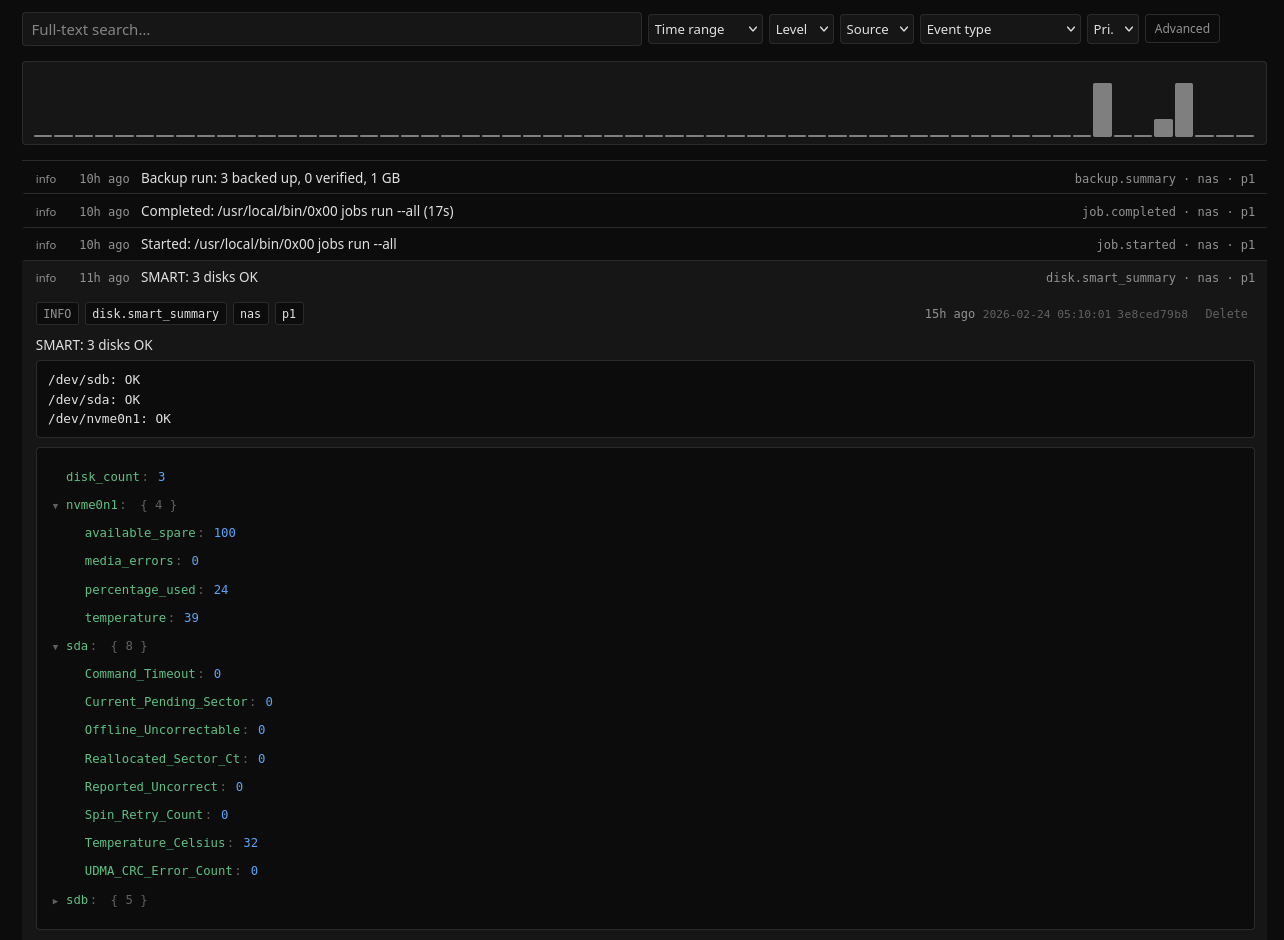
That’s it! All my drives are now monitored properly and I’ll sleep better at night.
If something goes wrong, I’ll get a desktop notification and a push notification on my phone thanks to nux.
Even if SMART monitoring won’t be 100% accurate in predicting drive failures, it’s way better than ignoring the metrics.
The full script with instructions is available in the nux repo. It also showcases my cron setup for running this daily.